Edited: 9 September 2018 (see changlelog)
Introduction
About a year ago FiveThirtyEight published a short article called “Is Your D&D Character Rare?”. It was a product of a deal between Curse and FiveThirtyEight which meant the data was not available to anyone else. I was a little jealous that I couldn’t play with the data and disappointed that they only counted class race combinations and called it a day.
Shortly after, I released a few tools (1,2) for a popular mobile application (3) which allowed me to collect my users’ character data.
After 3.5 months of data collection I have a whopping… 885 unique characters in my database that I can play with. Well… I’m not as popular as DnDBeyond but I don’t see anyone else waving around hundreds of character sheets for us to data mine, so it’ll have to do.
Is Your D&D Character Rare? II
To start with let’s redo the table from FiveThirtyEight. I am not going to pretend like I have many thousands of samples so instead of per 100,000 this shows class and race combinations per 100 characters. In FiveThirtyEight’s table, characters with multiple classes count once for each class. Here I divided multiclassed characters based on the proportion of their class levels. For instance, a character who is a Fighter 5/Rogue 15 will add 0.75 to the rogue count and 0.25 to the fighter count. Homebrew and UA classes are removed.
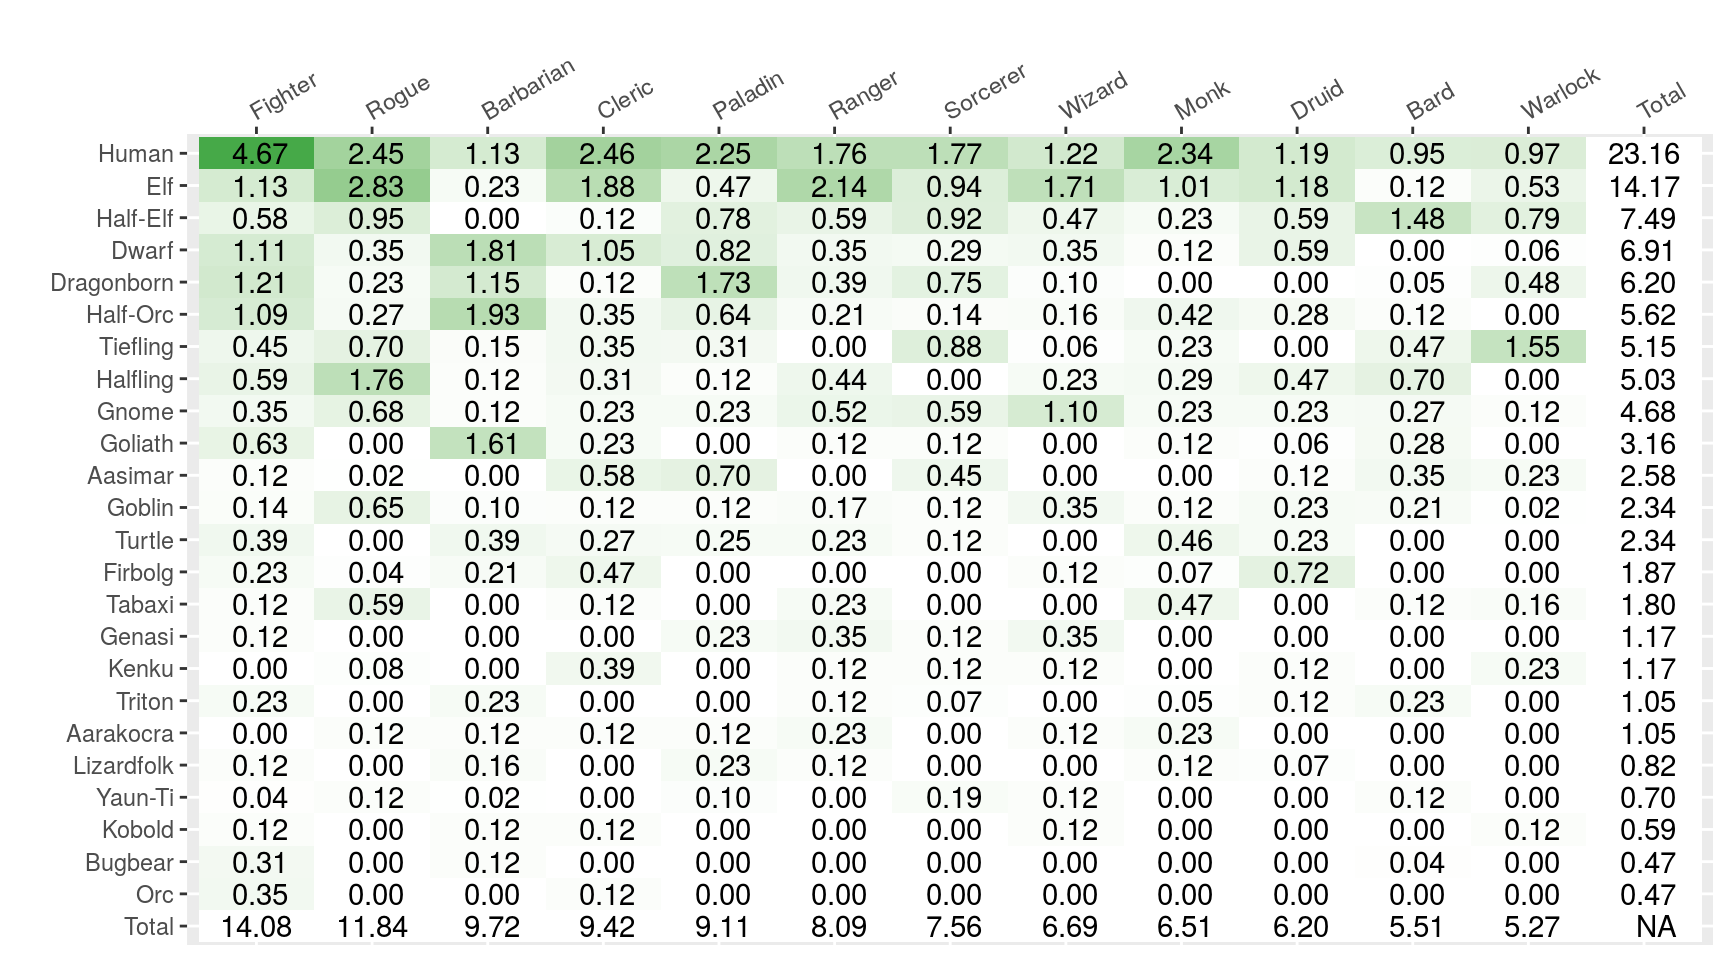
Despite the methodological differences, these results seem to correlate well with DnDBeyond data (Spearman’s ρ=0.74) even though we seem to disagree on the exact order of popularity. Graph below shows the % occurrence of a class/race combination in DnDBeyond data as presented in FiveThirtyEight and my data.
Is your character archetype rare?
This is a little hard to visualize in a single plot. Alas we are short on space so you’re going to have to mouse over to see the details. Each colored section shows a character archetype’s proportion to the rest of the archetypes for the class. They are ordered from bottom to top in order of frequency, so the brown always show the most popular archetype and it goes downhill (but upwards in the plot) from there.
Is your alignment rare?
Analysis of alignment in this dataset is difficult because unlike most other fields, it is not mandatory. It also isn’t something you are likely to forget about your character so there isn’t much incentive to fill it in. Only 29% of characters actually filled this field. I know I only filled it myself when testing my applications. It is entirely possible for the users’ choice to fill this box to introduce a bias so take these results with a grain of salt
Also, since its a free text field, some manual processing is required to make the most of this information (looking at you fellows with the “Awesome” and “Super Good” alignments). But that is still 254 characters so there you go:
The plot below shows character counts for each alignment.
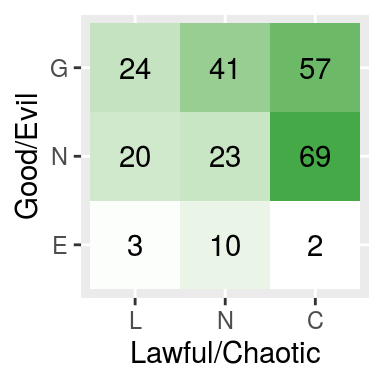
In general, lawful characters seem to be out of style these days. Let’s see how are the tendencies for individual classes. Below graph shows a mean alignment for each class. Multiclassed characters’ contribution is calculated as before. You can mouse over to see sample size and mean values. The numerical values are distributed from 1 to 3. 1 is Chaotic/Evil, 3 is Lawful/Good on the corresponding scales.
Darn! Most of the space in this graph is wasted. Even good old paladin has a chaotic tendency. Seems like 5e really helped players to break tradition. Meanwhile, Warlock is predictably the evilest class.
We can also do the same to backgrounds. Since they probably explain more than a character’s back story than a class does we might get more information.
This looks better. On extremes we have Knights who tend to be lawful, Folk Heroes and Hermits on the good, Bounty Hunters, Charlatans, Urchins on chaotic and Criminals as the only background left of Neutral on the Good/Evil line.
Obviously next logical step is racial profiling.
Take that racism! Half-orcs tend to be nicer characters than humans (Disclaimer: Like most, if not all of the one to one comparisons you can make here, difference between Half-Orc and Human “goodness” is not statistically significant, p = 0.37). Alas, Tieflings are as close to Chaotic Stupid as they are stereotyped as.
Are your feat choices rare?
Jeremy Crawford once tweeted
Another piece of D&D data: a majority of D&D characters don’t use feats. Many players love the customization possible with feats, but a larger group of players is happy to make characters without feats. Feats are, therefore, not a driving force behind many players’ choices. We can see whether or not our data agrees. On a surface look 33% of all characters have at least one feat. However, this is partially caused by the fact that a significant portion (46%) of our characters are between levels 1-3 and unless they are variant humans, they cannot have feats. We can see that by higher levels, feat adoption rates increase significantly, suggesting that once given the opportunity, players are likely to pick a feat.
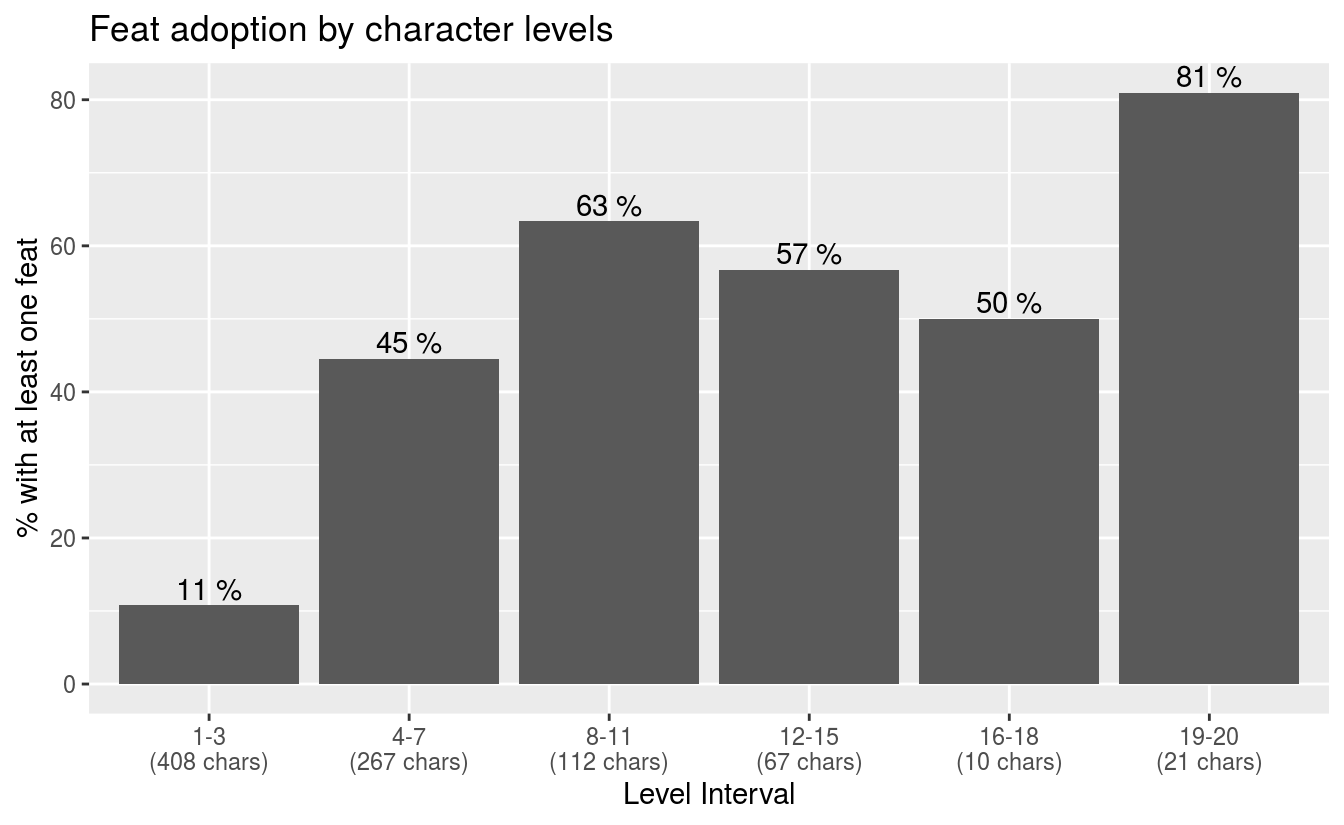
It can be postulated players spend most of their time between levels 4-15. 51% of all characters in this range has at least one feat. As I later discovered, this also somewhat correlates with the data in DnDBeyond though the percentages here are higher overall.
Note: I am getting messages about how this clearly shows how Crawford was super wrong. That’s not very accurate. It is true that my data shows a higher proportion of feat adoption than the D&D beyond data, however we cannot conclusively reject the statement “a majority of D&D characters don’t use feats” due to possible sampling errors. If we take level 4-15 interval into consideration, our sample size is 446. Based on this we have a 5% margin of error (95% confidence) on that 51%.
Next step is to examine which classes picks which feats, and which feats are the most popular. The graph below shows which feat is selected the most and by which class. Multiclassed characters are merged into their own category to reduce clutter. Any feat that is selected only twice or less is removed. Again, mouse over the bars to see details.
It is surprising that Elven Accuracy, a feat that is added in a supplement and restricted to elves, is as popular as many core book feats that are known to be highly effective. 10% of all elves and half-elves have this feat. Its appeal to both ranged weapon attackers and casters seems to make it a good choice for elves from many walks of life. Another interesting bit is that the Magic Initiate feat seems be very popular amongst classes with spellcasting ability. I was always under the impression that Magic Initiate’s main use case would be to add some magic to a mundane class.
We can also look into how feats synergize with each other. The network below shows how often feats are selected together. Unique connections are removed. Node sizes represent how many times a feat appeared together with another feat. The thickness of the lines between the nodes are determined by the number of characters both feats appear in.
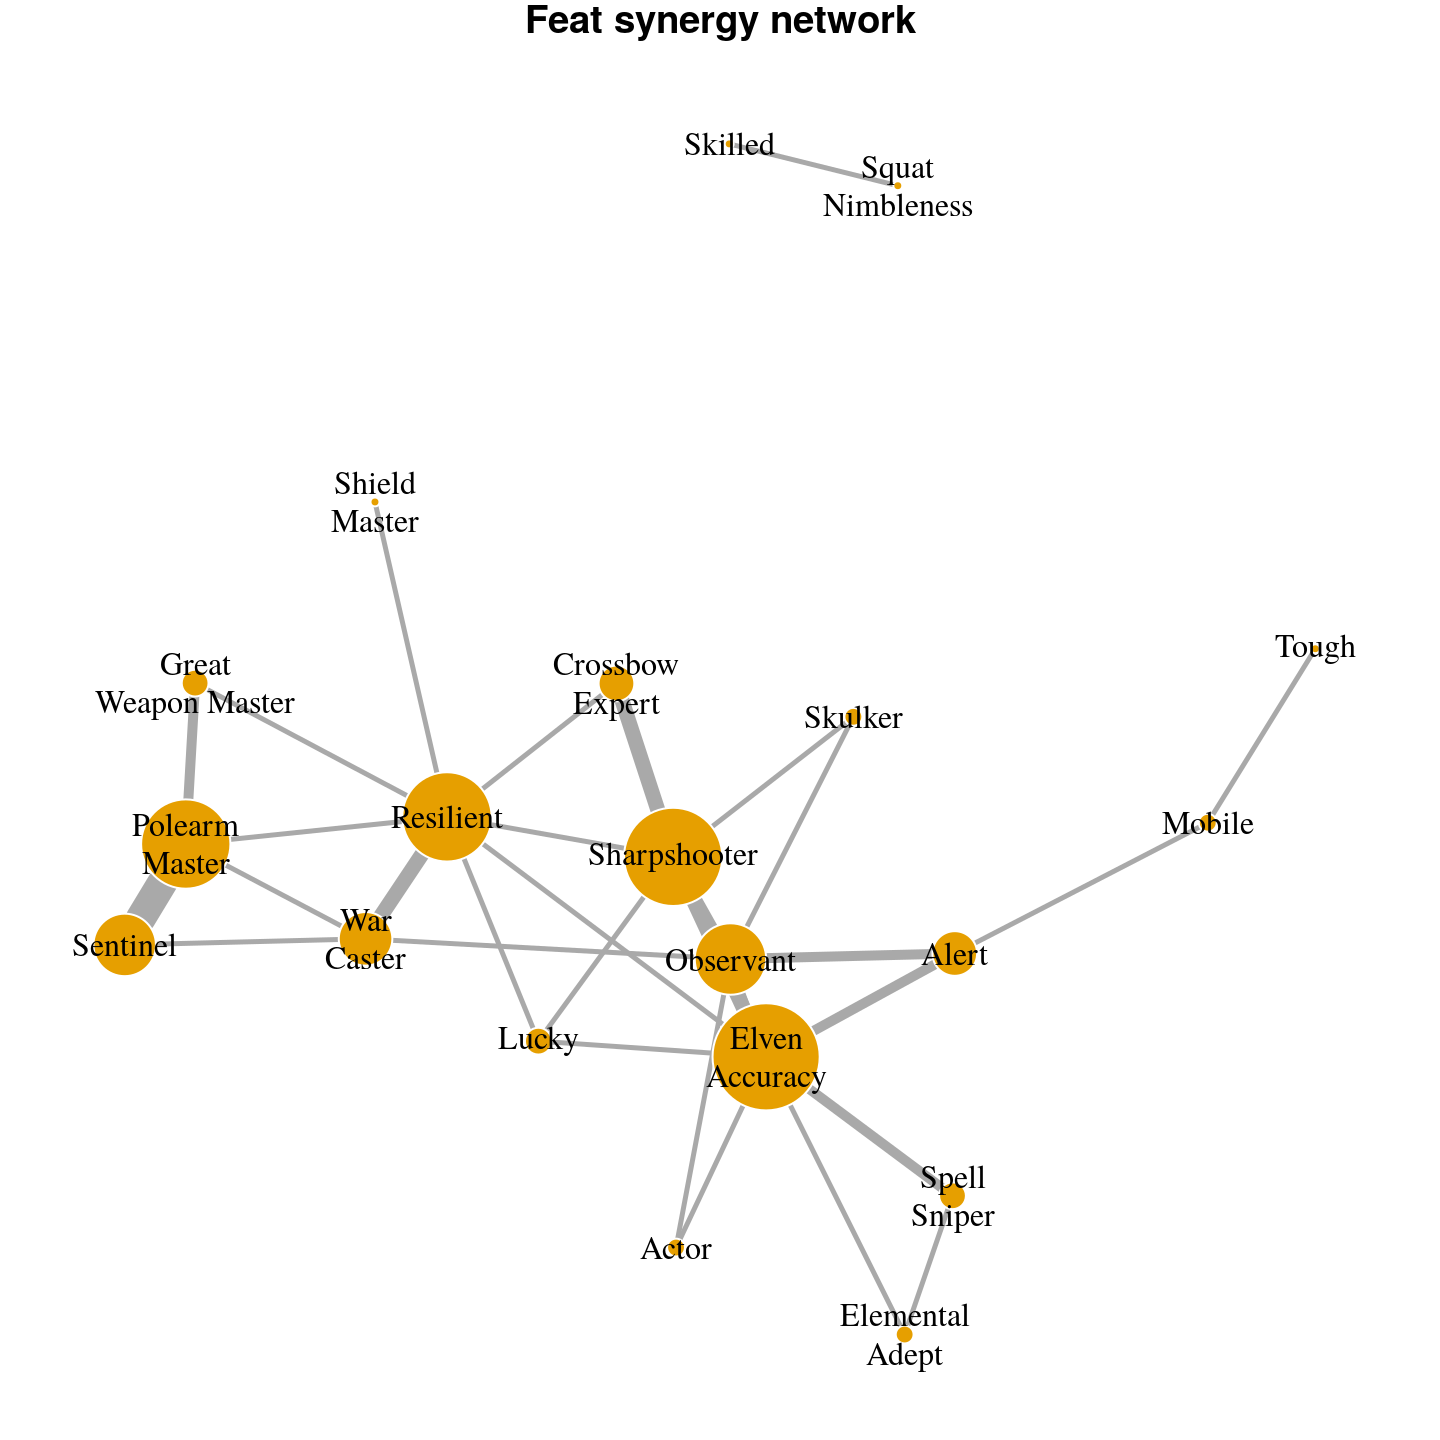
Before I say anything, I have to declare the connections in this graph aren’t particularly strong. There are too many feats and I have too few characters for high number of feats to appear together. The strongest link in this graph is based on 7 observations.
Yet, as it stands, the connections seem quite intuitive, so we are probably not staring at noise here. Robustness of elven accuracy is visible in this graph as it is both selected by characters trying to optimize their ranged and spell attacks. Crossbow Expert-Sharpshooter is known to be an effective combination to boost damage. Sentinel-Polearm Master is amazing for battlefield control.
Is your multiclass combination rare?
Since our dataset includes multiclassed characters, we can see which classed tend to appear together. Note that our sample size much smaller here (122 characters). Node sizes in the network below show how many times a class appeared in all multiclassed characters. The thickness of the lines between the nodes are determined by the number of characters both classes appear in. For instance, we see that most rangers multiclass with rogues, while most rogues multiclass with fighters.
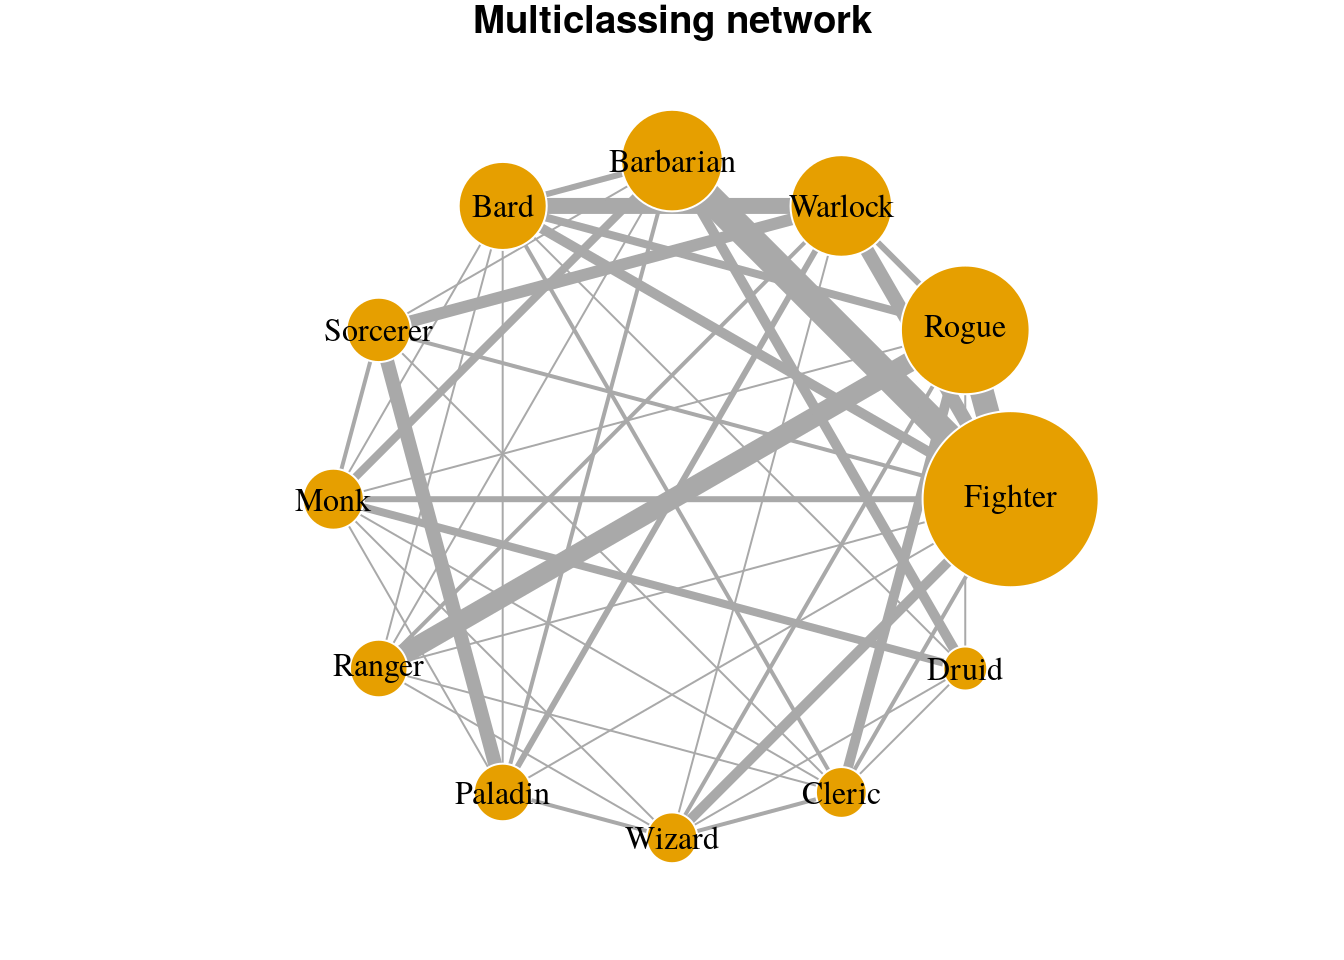
While this network is good to show which classes tend to be chosen together, it doesn’t give much information about how classes are distributed. In the below graph we look at what is ratio of class levels in individual characters. A Fighter 5/Rogue 15 would appear as a 25% data point in the Fighter column and 75% in the Rogue column. This will give us information about which classes are dipped in and which ones are used as the main class.
While there is a high amount of variation in the data, some conventional wisdom pops up through the means. Warlock is famous for its dipping potential and a Cleric level synergizes nicely with many other class features. I am a proud player of a Cleric dipped Fighter myself. I would avoid reading too much into this though. The variance is too high and sample size is too low to make reliable inferences.
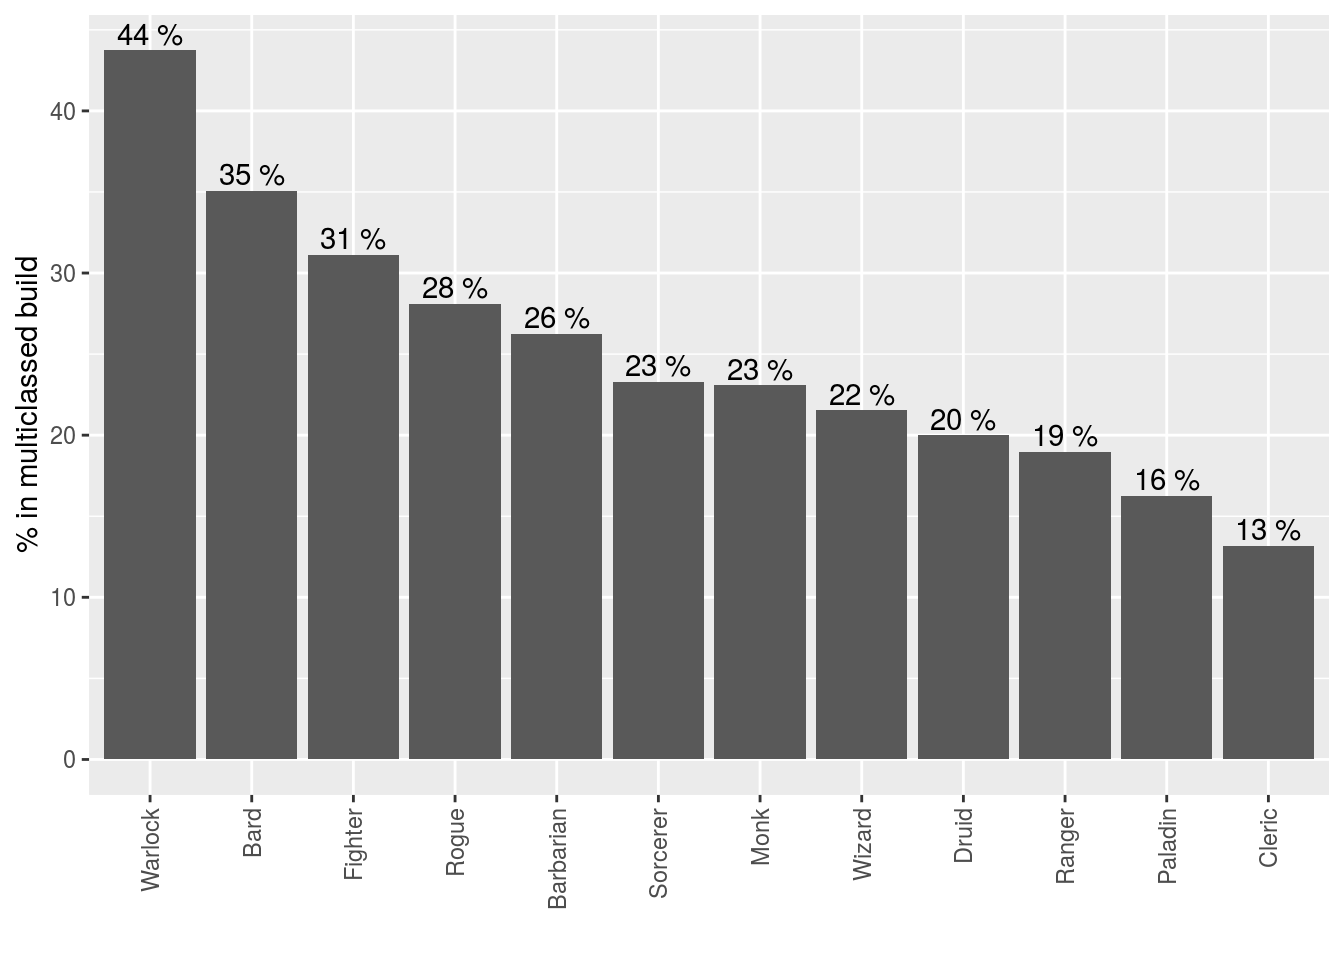
And finally let’s see which classes tend to appear in multiclassed builds compared to single classed ones
Is power gaming rare?
Ok that title is a stretch, but we have a format to stick to.
Both multiclassing and picking feats are somewhat advanced character building rules. While making the character building process complicated, they can be used to create frighteningly affective combinations (or get stuck waiting till the end of the campaign till their build gets everything they want). Intuitively, it wouldn’t be surprising to see that multiclassers are more likely to get feats to optimize their builds. Indeed, we see that 62% of multiclassed characters above level 3 chose to get a feat as opposed to 49% of single classed counterparts. A modest yet statistically significant difference (p=0.0028).
Are your spells rare?
Like alignment, spells were annoying to deal with. The app only allows writing free text as spells and doesn’t automatically fill anything other than cleric domain spells. Some casters don’t even seem to bother with filling anything and when they do, they sometimes shorten the name of the spell or add things like damage dice next to it. Thanks to some computer magic (string distances to all existing spell names), we can identify what they are trying to say with a satisfying accuracy. The low level heavy nature of the dataset also strikes again as higher level spells appear less and less frequent.
Below you see how frequently a spell is chosen by each class. Spells chosen by less than 3 people are removed. I also totally ignored multiclassed characters here because I’m not going to bother with trying to decide which spell came from which class.
If you don’t see high level spells that means not enough people agreed on any particular spells to make it to the table
| spellNames | count | % |
|---|---|---|
| Cantrip | ||
| Fire Bolt | 13 | 68 |
| Mage Hand | 11 | 58 |
| Minor Illusion | 7 | 37 |
| Message | 6 | 32 |
| Mending | 5 | 26 |
| Prestidigitation | 5 | 26 |
| Frostbite | 3 | 16 |
| Produce Flame | 3 | 16 |
| Ray of Frost | 3 | 16 |
| Shocking Grasp | 3 | 16 |
| Toll the Dead | 3 | 16 |
| Level 1 | ||
| Mage Armor | 16 | 84 |
| Find Familiar | 12 | 63 |
| Magic Missile | 12 | 63 |
| Detect Magic | 10 | 53 |
| Shield | 10 | 53 |
| Identify | 8 | 42 |
| Disguise Self | 6 | 32 |
| Thunderwave | 6 | 32 |
| Color Spray | 4 | 21 |
| Comprehend Languages | 4 | 21 |
| Absorb Elements | 3 | 16 |
| Burning Hands | 3 | 16 |
| Charm Person | 3 | 16 |
| Fog Cloud | 3 | 16 |
| Witch Bolt | 3 | 16 |
| Level 2 | ||
| Invisibility | 5 | 42 |
| Scorching Ray | 5 | 42 |
| Hold Person | 4 | 33 |
| Misty Step | 4 | 33 |
| Suggestion | 4 | 33 |
| Aganazzar’s Scorcher | 3 | 25 |
| Level 3 | ||
| Fireball | 5 | 62 |
| Counterspell | 4 | 50 |
| Animate Dead | 3 | 38 |
| spellNames | count | % |
|---|---|---|
| Cantrip | ||
| Sacred Flame | 22 | 56 |
| Light | 20 | 51 |
| Spare the Dying | 19 | 49 |
| Mending | 15 | 38 |
| Guidance | 12 | 31 |
| Thaumaturgy | 9 | 23 |
| Word of Radiance | 5 | 13 |
| Level 1 | ||
| Cure Wounds | 33 | 42 |
| Bless | 31 | 39 |
| Healing Word | 15 | 19 |
| Shield of Faith | 13 | 16 |
| Guiding Bolt | 12 | 15 |
| Fog Cloud | 11 | 14 |
| Inflict Wounds | 11 | 14 |
| Thunderwave | 11 | 14 |
| Bane | 10 | 13 |
| Detect Magic | 10 | 13 |
| Command | 9 | 11 |
| Divine Favor | 9 | 11 |
| False Life | 9 | 11 |
| Level 2 | ||
| Spiritual Weapon | 28 | 52 |
| Magic Weapon | 18 | 33 |
| Lesser Restoration | 14 | 26 |
| Prayer of Healing | 9 | 17 |
| Shatter | 9 | 17 |
| Gust of Wind | 8 | 15 |
| Ray of Enfeeblement | 7 | 13 |
| Gentle Repose | 6 | 11 |
| Heat Metal | 6 | 11 |
| Level 3 | ||
| Spirit Guardians | 12 | 33 |
| Revivify | 11 | 31 |
| Dispel Magic | 9 | 25 |
| Call Lightning | 7 | 19 |
| Crusader’s Mantle | 7 | 19 |
| Sleet Storm | 7 | 19 |
| Beacon of Hope | 6 | 17 |
| Mass Healing Word | 6 | 17 |
| Bestow Curse | 5 | 14 |
| Vampiric Touch | 5 | 14 |
| Level 4 | ||
| Death Ward | 10 | 56 |
| Guardian of Faith | 6 | 33 |
| Freedom of Movement | 5 | 28 |
| Blight | 4 | 22 |
| Control Water | 4 | 22 |
| Stoneskin | 4 | 22 |
| Banishment | 3 | 17 |
| Fabricate | 3 | 17 |
| Stone Shape | 3 | 17 |
| Level 5 | ||
| Raise Dead | 4 | 40 |
| Flame Strike | 3 | 30 |
| Mass Cure Wounds | 3 | 30 |
| spellNames | count | % |
|---|---|---|
| Cantrip | ||
| Fire Bolt | 13 | 52 |
| Mage Hand | 11 | 44 |
| Minor Illusion | 10 | 40 |
| Prestidigitation | 10 | 40 |
| Ray of Frost | 10 | 40 |
| Shocking Grasp | 10 | 40 |
| Chill Touch | 9 | 36 |
| Dancing Lights | 6 | 24 |
| Message | 5 | 20 |
| Light | 4 | 16 |
| Poison Spray | 4 | 16 |
| Control Flames | 3 | 12 |
| Guidance | 3 | 12 |
| Spare the Dying | 3 | 12 |
| Level 1 | ||
| Magic Missile | 11 | 41 |
| Shield | 9 | 33 |
| Mage Armor | 8 | 30 |
| Cure Wounds | 6 | 22 |
| Detect Magic | 5 | 19 |
| Thunderwave | 5 | 19 |
| Witch Bolt | 5 | 19 |
| Ice Knife | 4 | 15 |
| Sleep | 4 | 15 |
| Chaos Bolt | 3 | 11 |
| Chromatic Orb | 3 | 11 |
| Level 2 | ||
| Scorching Ray | 11 | 52 |
| Darkness | 5 | 24 |
| Levitate | 4 | 19 |
| Alter Self | 3 | 14 |
| Enhance Ability | 3 | 14 |
| Misty Step | 3 | 14 |
| Suggestion | 3 | 14 |
| Level 3 | ||
| Fireball | 5 | 62 |
| Level 4 | ||
| Banishment | 3 | 50 |
| Polymorph | 3 | 50 |
| spellNames | count | % |
|---|---|---|
| Cantrip | ||
| Druidcraft | 11 | 48 |
| Thorn Whip | 7 | 30 |
| Shillelagh | 6 | 26 |
| Guidance | 5 | 22 |
| Produce Flame | 5 | 22 |
| Poison Spray | 4 | 17 |
| Frostbite | 3 | 13 |
| Magic Stone | 3 | 13 |
| Level 1 | ||
| Cure Wounds | 10 | 50 |
| Healing Word | 9 | 45 |
| Entangle | 6 | 30 |
| Speak with Animals | 6 | 30 |
| Charm Person | 5 | 25 |
| Faerie Fire | 5 | 25 |
| Goodberry | 5 | 25 |
| Thunderwave | 4 | 20 |
| Create or Destroy Water | 3 | 15 |
| Detect Magic | 3 | 15 |
| Ice Knife | 3 | 15 |
| Level 2 | ||
| Moonbeam | 7 | 44 |
| Barkskin | 4 | 25 |
| Heat Metal | 4 | 25 |
| Pass Without Trace | 4 | 25 |
| Healing Spirit | 3 | 19 |
| Lesser Restoration | 3 | 19 |
| Spider Climb | 3 | 19 |
| Level 3 | ||
| Call Lightning | 4 | 44 |
| Conjure Animals | 4 | 44 |
| Plant Growth | 4 | 44 |
| Erupting Earth | 3 | 33 |
| Level 4 | ||
| Conjure Woodland Beings | 3 | 43 |
| Freedom of Movement | 3 | 43 |
| spellNames | count | % |
|---|---|---|
| Cantrip | ||
| Eldritch Blast | 16 | 80 |
| Light | 8 | 40 |
| Sacred Flame | 7 | 35 |
| Prestidigitation | 6 | 30 |
| Mage Hand | 5 | 25 |
| Blade Ward | 4 | 20 |
| Chill Touch | 4 | 20 |
| Guidance | 3 | 15 |
| Minor Illusion | 3 | 15 |
| Vicious Mockery | 3 | 15 |
| Level 1 | ||
| Hellish Rebuke | 6 | 35 |
| Hex | 5 | 29 |
| Protection from Evil and Good | 5 | 29 |
| Cure Wounds | 4 | 24 |
| Guiding Bolt | 3 | 18 |
| Shield | 3 | 18 |
| Witch Bolt | 3 | 18 |
| Level 2 | ||
| Misty Step | 5 | 71 |
| Flaming Sphere | 3 | 43 |
| Lesser Restoration | 3 | 43 |
| Level 4 | ||
| Banishment | 3 | 100 |
| spellNames | count | % |
|---|---|---|
| Cantrip | ||
| Vicious Mockery | 10 | 77 |
| Minor Illusion | 6 | 46 |
| Mending | 4 | 31 |
| Level 1 | ||
| Healing Word | 11 | 92 |
| Faerie Fire | 6 | 50 |
| Sleep | 5 | 42 |
| Tasha’s Hideous Laughter | 4 | 33 |
| Charm Person | 3 | 25 |
| Dissonant Whispers | 3 | 25 |
| Heroism | 3 | 25 |
| Thunderwave | 3 | 25 |
| Level 2 | ||
| Silence | 3 | 50 |
Is your game day rare?
My applications are they are purely utilitarian. One gives you a character sheet, the other is an interactive character sheet that automates your dice roll. It is somewhat reasonable to think that most people would be using them shortly before or during a game. Graphs below how many characters were created in each day of the week and below that there’s a punch card that shows individual hours.

Frankly not much to be said here. Most popular days of the week are obviously weekends and Friday. DnD takes time. More work = less DnD. Hours of day are somewhat unreliable as I didn’t correct for user time zones. US alone, which seems to be where most my users are coming from, can have 3 hours of difference. I could use IPs and detect locations to fix times but not going into that rabbit hole… How long before the game a player may want their character sheet is also a great source of variability. I mostly did this because I like punch cards…
About the data
Unique characters are acquired by grouping the characters that share the same name and class and picking the higher level version. This could have merged independent characters with tropey names like Grognak the Barbarian of Drizzt the Ranger but manual examination of the data showed no cases of characters who appear to be made by different people but still has the same name and class.
If a multiclassed character shares name with a single classed character, I assume they are duplicates if the single classed character is lower level and its class matches with one of the classes of the multiclassed character.
Any character above level 20 (there were 6) were removed.
9 Revised Rangers were merged back into the ranger class.
Most percentages are rounded to the nearest integer.
As all data, this data comes with caveats. It is a subset of all DnD players who are using a particular mobile application who also know about and use my applications and consented to let me to keep their character sheets. I don’t have reason to think that these would be enriching certain character building choices but it’s something to keep in mind.
In most parts of this document no information is provided about whether or not the differences are actually statistacilly significant. Sorry about that. Didn’t want to fill this place with too much math. For instance we can see that we have 24 battle masters vs 26 champions. This is not a statistically significant difference based on our sample size so we cannot state with high confidence that one is more popular than the other.
If you are interested in significance of any of these measures, you can take a peak at this article on wikipedia where formulas needed are explained. For some of these at least you should be able to get the information you need from the article.
If you have any questions, you can mail me. Mention “dndstats” somewhere in the text so you won’t be sent to spam.
Data access
This dataset is present in 2 forms: in its entirety that includes duplicates of characters and filtered version that only includes unique characters.
Go here for the complete data and here for the filtered one. Click the raw button to get them in plain text. Both have the same columns as explained below. The code to generate these tables can be found here.
Below are the descriptions of the columns in the files. If you think something you’d be interested in is missing, you can let me know.
name: This column has hashes that represent character names. If the hashes are the same, that means the names are the same. Real names are removed to protect character anonymity. Yes D&D characters have rights.
race: This is the race field as it come out of the application. It is not really helpful as subrace and race information all mixed up together and unevenly available. It also includes some homebrew content. You probably want to use the processedRace column if you are interested in this.
background: Background as it comes out of the application.
date: Time & date of input. Dates before 2018-04-16 are unreliable as some has accidentally changed while moving files around.
class: Class and level. Different classes are separated by | when needed.
justClass: Class without level. Different classes are separated by | when needed.
subclass: Subclasses. Again, separated by | when needed.
level: Total character level.
feats: Feats chosen by character. Separated by | when needed.
HP: Character HP.
AC: Character AC.
Str, Dex, Con, Int, Wis, Cha: ability scores
alignment: Alignment free text field. It is a mess, don’t touch it. See processedAlignment,good and lawful instead.
skills: List of skills with proficiency. Separated by |.
weapons: List weapons. Separated by |. It is somewhat of a mess as it allows free text inputs. See processedWeapons.
spells: List of spells and their levels. Spells are separated by |s. Each spell has its level next to it
separated by *s. This is a huge mess as its a free text field and some users included things like damage dice in them. See processedSpells.
day: A shortened version of date. Only includes day information.
processedAlignment: Processed version of the alignment column. Way people wrote up their alignments are manually sifted through and assigned to the matching aligmment. First character represents lawfulness (L, N, C), second one goodness (G,N,E). An empty string means alignment wasn’t written or unclear.
good, lawful: Isolated columns for goodness and lawfulness.
processedRace: I have gone through the way race column is filled by the app and asigned them to correct races. If empty, indiciates a homebrew race not natively supported by the app.
processedSpells: Formatting is same as the spells column but it is cleaned up. Using string similarity I tried to match the spells to the full list of spells available in the official publications. The spell is removed if the spell I guessed does not have the correct level or doesn’t include all words of the original spell and has too many modifications to be recognizable. It may have a few false matches but it should be mostly fine
processedWeapons: Similar to processedSpells, weapons column is matched to the closest official weapon with some restrictions.
levelGroup: splits levels into groups as used in the feat percentage plot. Only present in the filtered data but easy enough to make on your own.
About this document
The text of this document is licensed under CC BY 4.0 license
Here’s its source code. It’s not pretty.
The code blocks within the source code is licensed under MIT license.
Changelog
9 September 2018: * Data from 100 more characters added.
19 August 2018:
- Typo in data release. Same name hash means names are the same not characters.
- Alignment flip again to match memes
18 August 2018 2:
- Fix bug that counts the percentage of people who wrote their alignments down wrong
- Flip alignment axes
- Disclaimer about feat adoption
18 August 2018:
- Data from additional 82 characters incorporated. No significant changes observed.
- Links to the data added
- Spell information added
- Feat bar plot now filters any feat that is taken less than 3 times instead of 2
2 August 2018:
- License information added.
- A forgotten word added.
- Data from 40 additional characters incorporated. No significant changes observed.
- Claim about increased decency of Half-Orcs softened
- Changelog added
28 July 2018:
- Initial release